Tracks closed, spectators were absent, and schedules were changed beyond recognition. Yet, amid a year unlike any other in Thoroughbred racing, the total 2020 US handle dipped only 1.3% from its 2019 totals.
What was remarkable about that modest dip — from $10.871 billion in 2019 to $10.727 billion in 2020 — is that it came with 23.2% fewer races.  Hard as it may be to comprehend, handle increased seven of the year’s 12 months. Before the pandemic turned matters on its ear, handle increased nearly 12% in the first two months of the year.
2020’s handle actually surpassed 2019’s mark by 9.5% over the second half of the season. This was a byproduct of the Triple Crown schedule adjusting for the COVID-19 outbreak in the spring. The Kentucky Derby moved from May to September, which explained the 31.5% drop in May handle year-over-year, and the 30% September jump from 2019.
2020 US Thoroughbred Handle–Month-by-Month
| Month | 2020 | 2019 | % Change |
| Jan. | $865,486,325 | $776,177,246 | +14.5% |
| Feb. | $893,163,717 | $795,675,257 | +12.5% |
| March | $721,693,989 | $935,917,879 | -22.9% |
| April | $618,264,282 | $835,618,501 | -26.0% |
| May | $881,913,636 | $1,287,396,296 | -31.5% |
| June | $978,376,838 | $970,039,670 | +0.9% |
| July | $1,076,346,352 | $920,748,508 | +16.9% |
| Aug. | $1,133,113,331 | $1,154,052,191 | -1.8% |
| Sept. | $1,021,243,429 | $785,688,356 | +30.0% |
| Oct. | $914,457,403 | $763,694,073 | +19.7% |
| Nov. | $883,489,646 | $947,842,811 | -6.8% |
| Dec. | $740,295,607 | $698,821,676 | +5.9% |
| Total | $10,727,844,555 | $10,871,672,964 | -1.3% |
Triple Crown Suffered a Triple Handle Hit from 2019
Taking that one Triple Crown race further, the October Preakness Stakes created a 19.7% handle boost from 2019’s October totals.
That’s not to say the Triple Crown races didn’t suffer handle-wise. All three Classic races went off without spectators. This explains how not playing host to 160,000-plus spectators carved 49% out of the Derby’s 2020 handle. With a nearly empty Pimlico, the Preakness took a 50% handle hit.
The Belmont Stakes opened the Triple Crown season instead of closing it, but it did so without its customary 100,000-120,000 fans at Big Sandy. And that’s how the Belmont suffered a 33% plunge in 2020 handle.
The six biggest days on the racing calendar: the Triple Crown races, the two-day Breeders’ Cup, and Travers Saturday at Saratoga, endured a $230 million drop in combined handle. That accounts for 2020’s overall handle drop, slight as it was.
Spring Swoon Prefaced Fall Flurry
Individually, May’s 31.5% drop was the largest monthly dip of the year. It followed a 26% April handle plunge and a 23% March drop. That was a byproduct of the pandemic shutting down all but five tracks: Gulfstream Park, Tampa Bay Downs, Oaklawn, Fonner Park, and Will Rogers Downs.
Many of the biggest tracks in the US – Santa Anita Park, Belmont Park, Churchill Downs, Keeneland, and Laurel Park, among others — closed for most of the spring. As a result, both Nebraska’s Fonner and Oklahoma’s Will Rogers reported record handles as action-starved horseplayers discovered the tiny tracks.
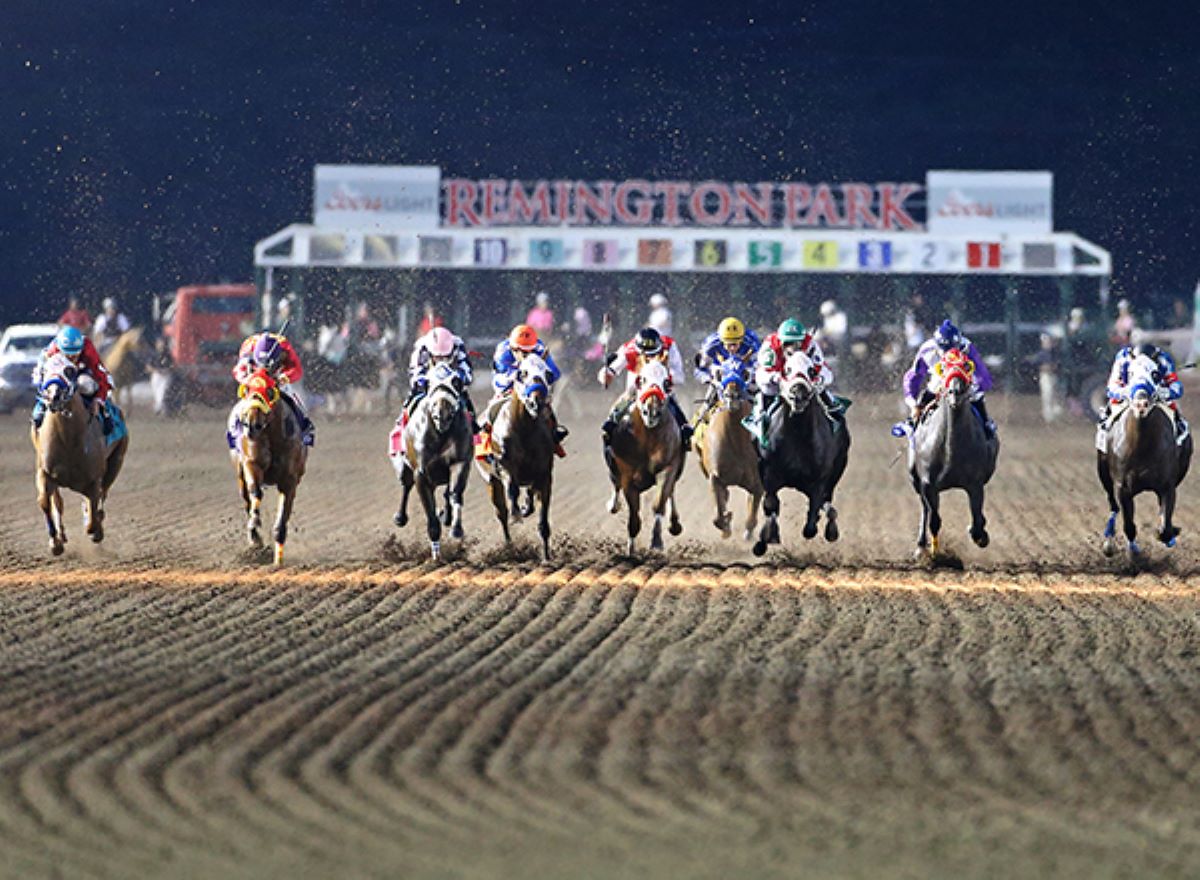
Oklahoma’s Remington Park and Indiana Grand both enjoyed record handles. Remington Park’s handle rose 31.8%, surpassing $100 million for the first time in track history. Indiana Grand’s handle climbed nearly 61% in 2020.
2020 US Thoroughbred Handle-Key Indicators
| Category | 2020 | 2019 | % Change |
| Handle | $10,727,844,555 | $10,871,672,964 | -1.3% |
| Races | 27,519 | 35,819 | -23.2% |
| Runners | 218,720 | 269,954 | -19.0% |
| Average Field Size | 7.95 | 7.54 | +5.5% |
| $ Per Runner | $49,048 | $40,272 | +21.8% |
The reduced racing dates created increased fields. The average field size ticked up 5.5%, from 7.54 to 7.95 runners per race. This trend bears watching in 2021, especially at California tracks like Santa Anita, which suffer from smaller fields and reduced racing opportunities.
Two lessons come from these numbers. First, horseracing’s resilience – not to mention the availability of automatic deposit wagering (ADW) apps – is constant. Second, it needs more than that resilience to grow in a pandemic-created climate.