A September Kentucky Derby produced stronger third-quarter numbers in 2020 vs. 2019, according to the Equibase Economic Indicators in Thoroughbred Racing.
Horseplayers wagered more than $3.2 billion in the third quarter. That represents a 12.7% bump from 2019’s figures of $2.92 billion.
At the same time, America’s most wagered upon race running the first Saturday in September instead of the first Saturday in May resulted in a 29.6% increase in September 2020 wagering. Bettors put down more than $1.039 billion in September, compared to $801.98 million in 2019. A September Derby was a big reason why.
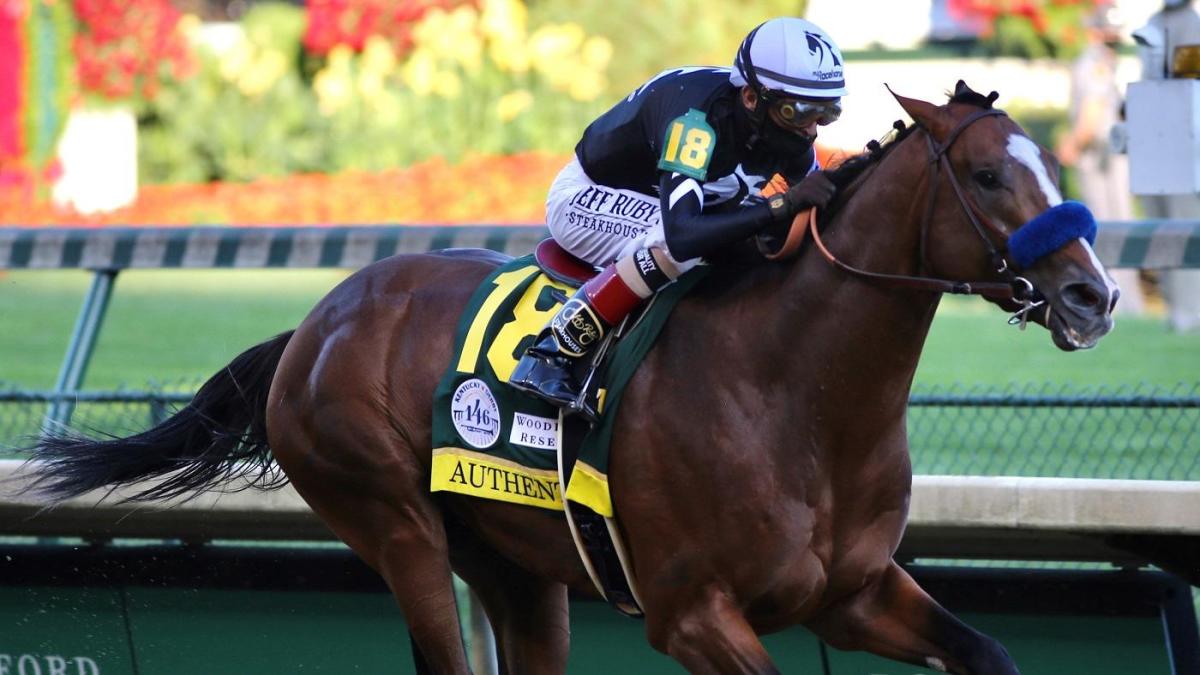
That even came with a decline in Kentucky Derby day wagering, which Churchill Downs attributes to the lack of on-track wagering and a prohibitive favorite in Tiz the Law. The Belmont Stakes and Travers Stakes champion lost a fierce stretch battle to Authentic.
September Derby Boosts Year-Over-Year Wagering
Where the September Derby made an impact can be seen through the prism of overall 2020 wagering, which is down only 2.8% for the year. Through August, it was down 6.2%.
Again, the average wager per race day continued to be one of the sport’s strongest indicators. For September, that number jumped 46.3%. For the third quarter, it leaped 31.6% and, year to date, it’s up 36.1%.
Thoroughbred Economic Indicators–September 2020 vs. September 2019
| Indicator | September 2020 | September 2019 | Change (%) |
| Wagering on US Races | $1,039,737,336 | $801,998,134 | +29.64% |
| US Purses | $110,251,841 | $118,229,293 | -6.75% |
| US Race Days | 365 | 412 | -11.41% |
| US Races | 3,101 | 3,329 | -6.85% |
| US Starts | 24,447 | 25,231 | -3.11% |
| Average Field Size | 7.88 | 7.58 | +4.02% |
| Avg. Wagering Per Race Day | $2,848,595 | $1,946,597 | +46.34% |
| Avg. Purses Per Race Day | $302,060 | $286,964 | +5.26% |
Source: Equibase
This is a byproduct of two factors, the first being a 28.6% decline in race days year to date, down from 3,515 last year to 2,509 this year. The second stems from horse racing being the only sport still running during the depths of the COVID-19 pandemic last spring and early summer.
In the third quarter, tracks fought not only the coronavirus’ lingering effects, but other natural disasters. Both Santa Anita Park and its Northern California sister track, Golden Gate Fields, took scheduling hits due to wildfires and the ensuing poor air quality. Santa Anita delayed its fall meet opening a week while Golden Gate Fields scrubbed several days of racing.
Bottom Line is a Double-Edged Sword
No matter the track, most opened without spectators or with limited attendance. That sent bettors to their phones, tablets, and laptops, logging on to advance deposit wagering (ADW) apps. This adds to the sport’s overall bottom line, but creates economic issues for individual tracks since ADW outlets return a small percentage of handle to the tracks.
Thoroughbred Economic Indicators–Third Quarter 2020 vs. Third Quarter 2019
| Indicator | Third Quarter 2020 | Third Quarter 2019 | Change (%) |
| Wagering on US Races | $3,293,292,589 | $2,921,407,748 | +12.73% |
| US Purses | $305,013,587 | $349,865,237 | -12.82% |
| US Race Days | 1,208 | 1,411 | -14.39% |
| US Races | 9,989 | 11,097 | -9.98% |
| US Starts | 76,402 | 80,738 | -5.37% |
| Average Field Size | 7.65 | 7.28 | +5.13% |
| Avg. Wagering Per Race Day | $2,726,236 | $2,070,452 | +31.67% |
| Avg. Purses Per Race Day | $252,495 | $247,956 | +1.83% |
Source: Equibase
Looking at this through two tracks, Saratoga cracked the $700 million mark for the second consecutive year, despite running without spectators. Across the country, Del Mar reported an 8% increase in handle. That, despite running 25% fewer races in 2020, and canceling one weekend of races due to a coronavirus outbreak in its jockey colony.
Elsewhere, purses continue slumping across all time frames as many tracks miss their casino revenue streams and in-person attendance. This, as the average race field size continues increasing.
Fans Need Racing Atmosphere to Build the Sport
Overall, the report paints a mixed picture of the sport’s economic health. That’s been a recurring theme throughout 2020. The lack of fans in the stands has been an issue for years now. Horse racing officials hope the sport’s solo days in the spotlight brought more fans – and bettors – into the fold.
Normally, Equibase releases its Economic Indicators report quarterly. Due to the pandemic, however, it is releasing them monthly, to give a clearer picture of the sport’s financial health and the coronavirus’ effects.
Thoroughbred Economic Indicators–2020 vs. 2019
| Indicator | YTD 2020 | YTD 2019 | Change (%) |
| Wagering on US Races | $8,348,815,108 | $8,594,182,019 | -2.86% |
| US Purses | $629,176,645 | $893,867,369 | -29.61% |
| US Race Days | 2,509 | 3,515 | -28.62% |
| US Races | 20,895 | 28,554 | -26.82% |
| US Starts | 164,476 | 210,977 | -22.04% |
| Average Field Size | 7.87 | 7.39 | +6.53% |
| Avg. Wagering Per Race Day | $3,327,547 | $2,445,002 | +36.10% |
| Avg. Purses Per Race Day | $250,768 | $254,301 | -1.39% |
Source: Equibase