Equibase’s monthly report on Economic Indicators in Thoroughbred Racing for June revealed the first uptick in racing handle since February, before the COVID-19 pandemic wreaked havoc on the industry.
June’s uptick is slight, 0.76% over June 2019. This result is due to tracks opening or re-opening throughout June. That said, most tracks are operating without fans who create betting handles held exclusively by racetracks. Racetracks in some states, such as Lone Star Park in Texas and Canterbury in Minnesota, opened to fans because those states forbid anything but in-person betting.
That, however, comes with perils, as Lone Star Park discovered Sunday. It abruptly closed after Sunday’s first race due to the coronavirus. The Paulick Report cited multiple sources saying a track employee who had regular contact with jockeys or their valets tested positive for COVID-19.
Thoroughbred Economic Indicators-June 2020
| Indicator | June 2020 | June 2019 | % Change |
| Wagering on US Races | $998,448,300 | $990,923,384 | +0.76 |
| US Purses | $69,463,605 | $115,194,834 | -39.7% |
| US Race Days | 300 | 499 | -39.8% |
| US Races | 2,485 | 3,905 | -36.3% |
| US Starts | 20,146 | 27,726 | -27.3% |
| Average Field Size | 8.11 | 7.1 | +14.1% |
| Avg. Wagering Per Race Day | $3,328,161 | $1,985,818 | +67.7% |
| Avg. Purses Per Race Day | $231,545 | $230,851 | +0.3% |
Source: Equibase
Notably, June’s wagering increase came with 36% fewer races. Those races, however, featured larger field sizes, increasing from 7.1 horses per race to 8.1. Also notable is the slight uptick in average purses per race day, which nosed up 0.3%.
Everyday Wagering Continues Climb
Because the pandemic shut down nearly every other major sporting event worldwide, average wagering per race day increased significantly. June’s average vaulted 67.5% from its 2019 numbers, totaling more than $3.3 million.
All of this, however, can’t mask the pandemic’s impact on the industry. June’s purses plunged nearly 40%, and race days fell by virtually the same amount.
Second-quarter numbers are equally mixed. Total wagering from April-June 2020 fell 18.8%, and purses continued their downward trend this year, falling more than 62.4%. This, because of falling revenue at tracks and the closure and limited re-opening of racetrack casinos and OTB parlors. Those facilities fund sizable portions of purses, compared to advance deposit wagering (ADW), little of which goes to the tracks.
Quarterly Numbers Mirror Monthly Totals
The flip side of that mirrors June’s numbers when it comes to field size and average wagering per race day. Those numbers climbed again, increasing 16.5% in terms of field numbers, to 8.42 horses per start. Average wagering per race day more than doubled to more than $5 million, as tracks such as Belmont Park opened, and Churchill Downs and Santa Anita wound their meets down toward the end of the month.
Second Quarter 2020 vs. Second Quarter 2019
| Indicator | 2nd Quarter 2020 | 2nd Quarter 2019 | % Change |
| Wagering on US Races | $2,546,352,350 | $3,137,805,499 | -18.8% |
| US Purses | $118,929,007 | $316,882,492 | -62.4% |
| US Race Days | 508 | 1,260 | -59.6% |
| US Races | 4,290 | 10,167 | -57.8% |
| US Starts | 36,101 | 73,409 | -50.8% |
| Average Field Size | 8.42 | 7.22 | +16.5% |
| Avg. Wagering Per Race Day | $5,012,505 | $2,490,322 | +101.2% |
| Avg. Purses Per Race Day | $234,112 | $251,494 | -6.9% |
Source: Equibase
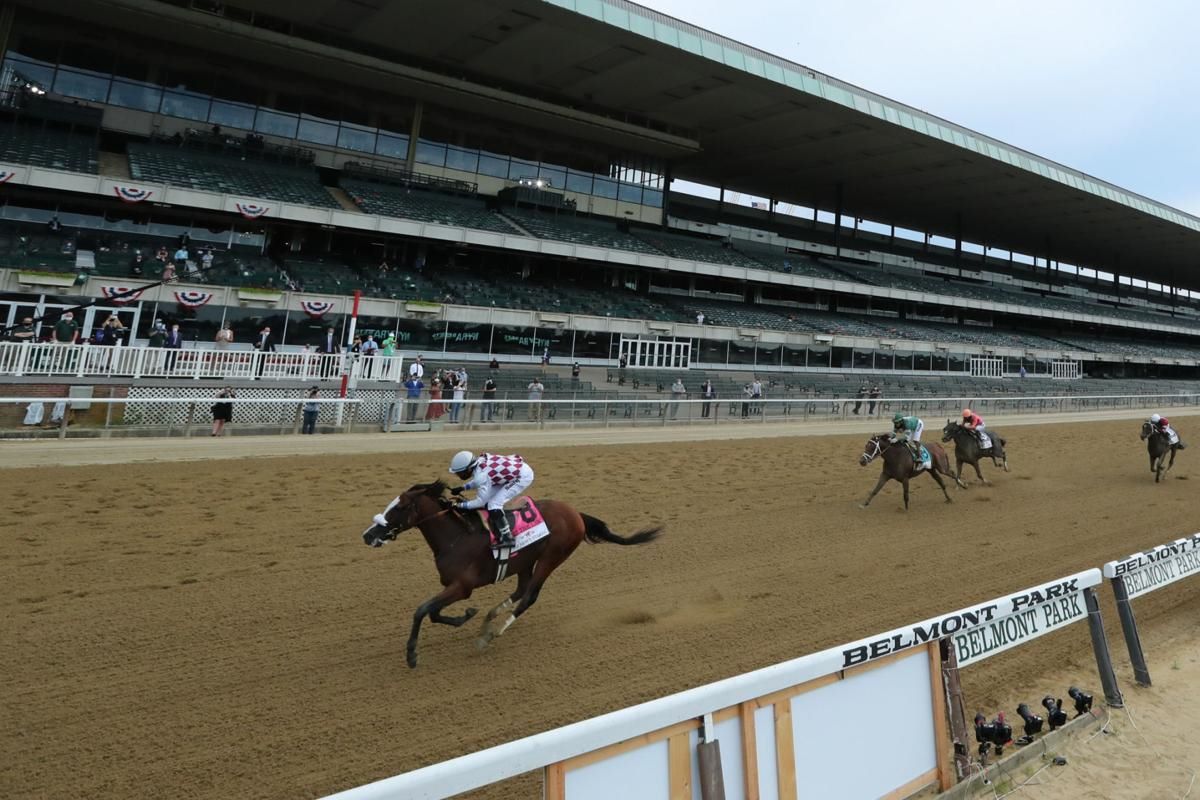
Speaking of Belmont Park, it led all tracks in total handle, paced by an 84% increase in its opening-week handle. The New York track brought in more than $276 million, even with a 33% handle drop from the 2019 Belmont Stakes to 2020. Gulfstream Park and Churchill Downs completed the June handle trifecta. Belmont Park’s handle was similar to its June 2019 numbers, but both Gulfstream (a 23.6% increase to $136.8 million) and Churchill Downs (a 27.2% increase to $112 million) enjoyed significant year-over-year boosts.
All three tracks also enjoyed healthy field sizes, averaging more than 8.5 starters per race as horsemen flocked to the strong cards all three tracks wrote.
Looking forward to July, Monmouth Park in New Jersey, Del Mar in California, and Saratoga in New York figure to pick up the riding crops from Belmont Park, Churchill Downs, and Santa Anita Park. Keeneland’s five-day, stakes-loaded meet, beginning this week, should provide the initial boost.